Businesses of any size can use their company’s annual report to showcase successes and challenges, accomplishments, opportunities for growth and a vision for the future.
The trick? Presenting all that information in a way that makes people want to read it.
Does the term “annual report” conjure adjectives like dull, dry, black-and-white or boring? Then we’ve got good news: These days, companies are getting more creative about how they convey information—and it doesn’t have to be a mammoth project that stresses you out from here to December. There are plenty of easy tools (and helpful experts, raising Firespring’s collective hand) that can aid you in creating your report without all the angst and late-night headaches.
Start with these three tips, and then if you want more, let’s chat.
Show—don’t just tell—your data.
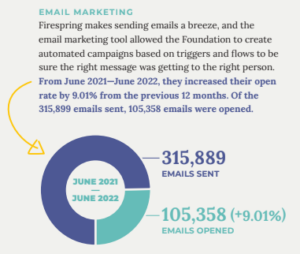
The best annual reports present key information visually. For instance, infographic-inspired elements can give your readers’ eyes a rest. Charts and graphs break up content and let you display important data without tons of text. And when you show your readers numbers and data visually—rather than list it all in blocky bulk—it’s easier to quickly draw conclusions and recognize trends.
If your report isn’t data-heavy, you can still incorporate visual elements. For example, invite readers to look inside with a unique cover page, then use illustrations to break things into clear sections. Icons can draw eyes toward key information and create space around the text, allowing it to breathe.
Make your annual report more engaging with photos.
Fact of the universe: people love pictures. So why not make your annual report more interesting by including photos that tell stories about your org and the individuals you serve? Plus, adding photography is another great way to break up content.
You could go with stock photos—that’s a fine choice. But first, think about personalizing your report with in-house images, if you have them. Real-life action shots are the perfect way to make your stories jump off the page and add a powerful human element to your report—a must-have if you’re striving for engagement in the age of social media.

Tell your story using multiple formats.
Once you’ve outlined your annual report and know what to include, think about how you’ll present it. For example, trying to appeal to casual readers? Consider supplementing with a “TL;DR” version to go with the big enchilada. You could even send a shorter, printed summary to your audience with a QR code that links to a landing page containing more details and a full download.
In other words, think outside the typical annual report box. You have a ton of options, and all of them can work in tandem to relay the big picture and help your audience learn more about your organization or brand while building trust.
Get started on your annual report.
If you’re ready to take on the task yourself, great! But if you prefer a little assistance, we’ve got a whole team of content writers and designers who’d be thrilled to lend a hand and take your annual report to the next level.
Bonus: Firespring can make your printed piece a reality. Our presses are ready to roll!
Let’s chat about the next steps—not only for your annual report but any other marketing, printing or web-related need.

